My portfolio
My portfolio showcases my diverse skill set in Python, PySpark, SQL, machine learning, and data visualization, complemented by my web development abilities using HTML and CSS. The home page features a brief introduction and a summary of my skills, with a link to my projects overview . Each project highlights specific achievements, such as data analysis with Python, building machine learning models, processing large datasets with PySpark, and creating interactive dashboards. The entire site is designed with responsive HTML/CSS and includes visualizations created with libraries like Matplotlib and Plotly, all hosted on platforms like GitHub Pages.

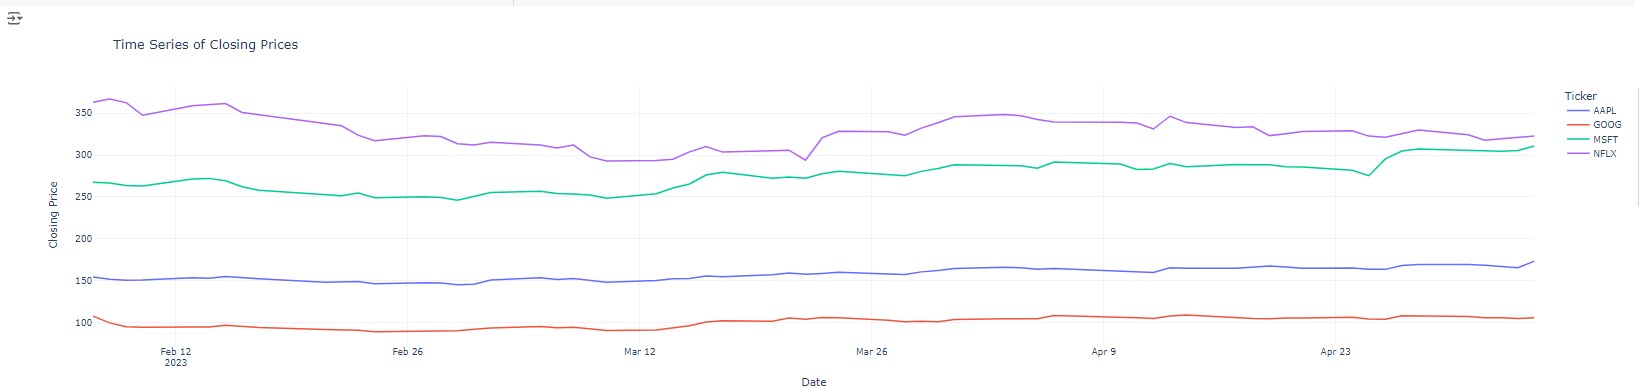
Stock Market Anlaysis
Project Overview: This project aims to analyze stock market trends using time series data of closing prices. By leveraging the Plotly library for interactive visualizations, we will explore historical price movements of selected stocks, identify patterns, and assess risk and return profiles.
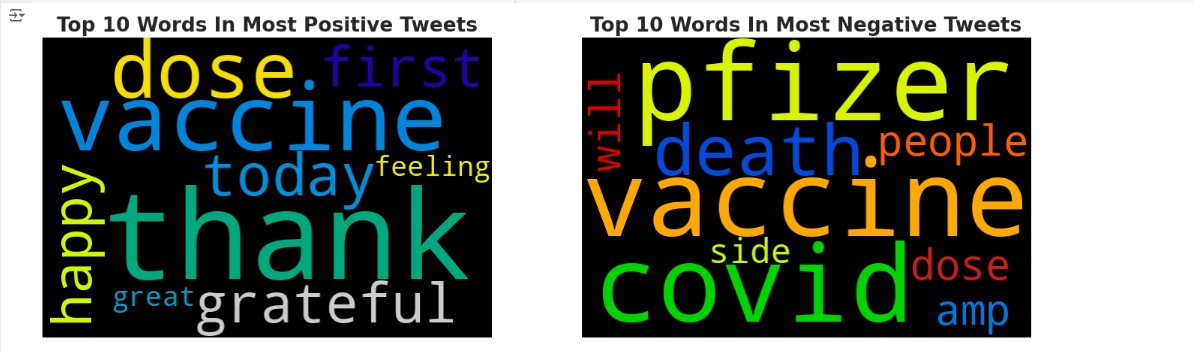
Sentiment Anlaysis using Natural Language Toolkit
This project explores public sentiment regarding COVID-19 using natural language processing (NLP) techniques. The analysis leverages the NLTK library for text processing, regular expressions for pattern matching, and visualization tools such as Matplotlib and WordCloud to present the findings effectively.
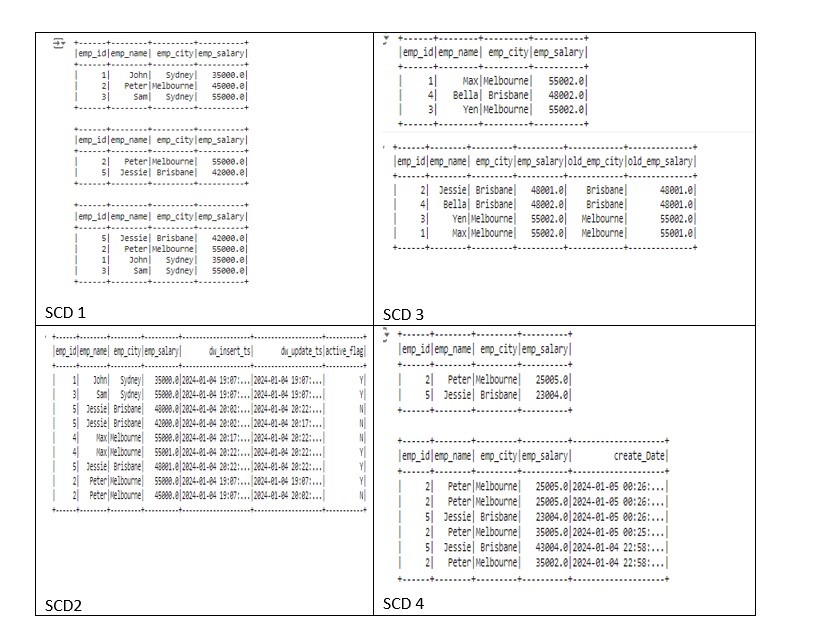
SCD Logic
This project focuses on the implementation of Slowly Changing Dimensions (SCD) types 1, 2, 3, and 4 using PySpark and Delta Lake. SCDs are crucial in data warehousing as they help manage and maintain historical data in a structured manner. By leveraging Delta Lake's capabilities, this project aims to create an efficient and scalable solution for handling evolving data in a business environment.
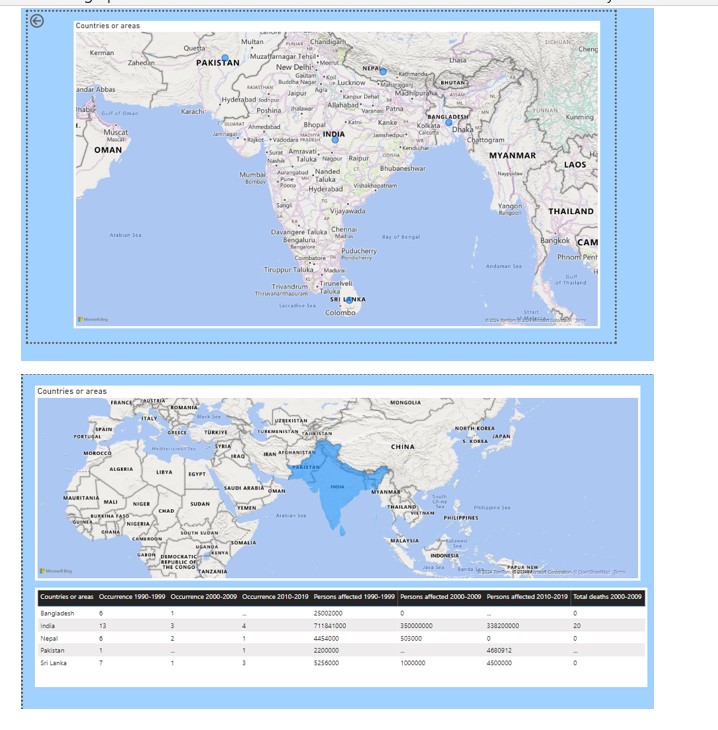
Power BI Interactive Dashboards
This dashboard aims to provide a comprehensive view of affected areas, allowing users to easily identify trends, compare regions, and drill down into specific data points. It's designed for stakeholders needing insights for resource allocation, emergency response, or strategic planning.